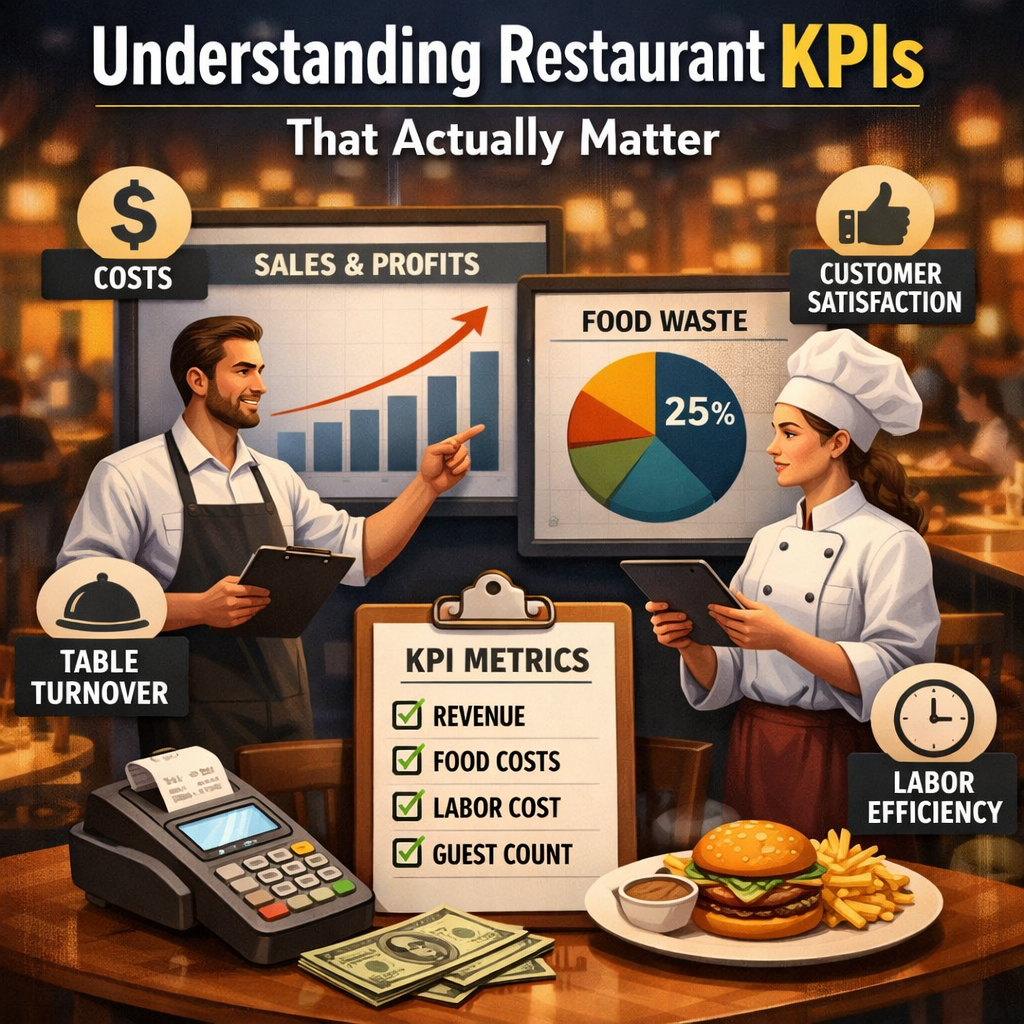
Running a restaurant often feels like juggling dozens of moving parts at once. Behind the scenes, restaurant KPIs help bring order to that chaos by showing how different parts of the operation perform together. Instead of relying on instinct alone, clear indicators reveal patterns in sales, staffing, and guest experience. When tracked consistently, they offer a steady way to understand what is really happening day to day.
Watching Costs Without Losing Control
One of the first figures that draws attention is the labor cost percentage. Staffing is essential for service, yet payroll can quickly absorb revenue if schedules are not aligned with demand. Comparing hours worked with actual sales makes it easier to see whether a shift was properly balanced. Small adjustments in scheduling often have a noticeable impact over time.
Another number closely tied to stability is the prime cost calculation, which combines food and labor expenses. Looking at these two major costs together gives a clearer sense of financial health than reviewing them separately. Even strong sales can feel disappointing if these expenses quietly rise. Regular review helps catch gradual shifts before they become larger problems.

Understanding Sales Beyond the Total
Revenue alone rarely tells the whole story. Careful tracking of restaurant sales metrics can uncover which time periods perform well and which menu categories carry the operation. An increase in total sales might look positive, yet the mix of items sold can change margins in unexpected ways. Observing trends over weeks rather than days helps separate temporary spikes from lasting patterns.
At the same time, numbers related to the guest experience should not be ignored. Thoughtful attention to guest satisfaction metrics highlights how diners actually feel about their visit. Feedback scores, return visits, and average review ratings often explain shifts in sales that might otherwise seem random. When experience and revenue move in the same direction, the business feels more predictable.
Turning Data Into Clear Insight
Collecting figures is one thing; understanding them is another. A simple restaurant dashboard can bring key data together in a way that makes trends easier to spot. Instead of digging through scattered reports, a centralized view shows how costs, sales, and service indicators interact. This clarity reduces emotional reactions to slow days and encourages steady, informed decisions.
Used wisely, restaurant KPIs are not about chasing perfection. They serve as reference points that guide adjustments rather than dictate every move. Over time, familiar patterns begin to emerge, making it easier to anticipate busy periods, manage expenses, and maintain consistent service.
A well-run restaurant depends on more than good food and atmosphere. Clear tracking of restaurant KPIs connects daily activity with long-term stability. By watching costs, sales patterns, and guest feedback together, it becomes easier to see the full picture and respond with confidence instead of guesswork.